
2022 Data Visualizations
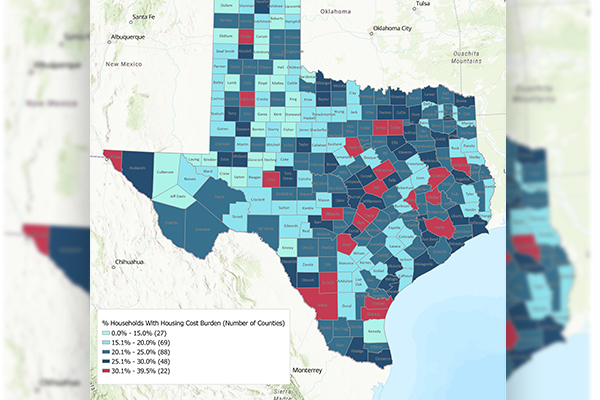
When a household spends more than 30% of their monthly income on housing costs. These include rent or mortgage payments, utilities, and other fees.
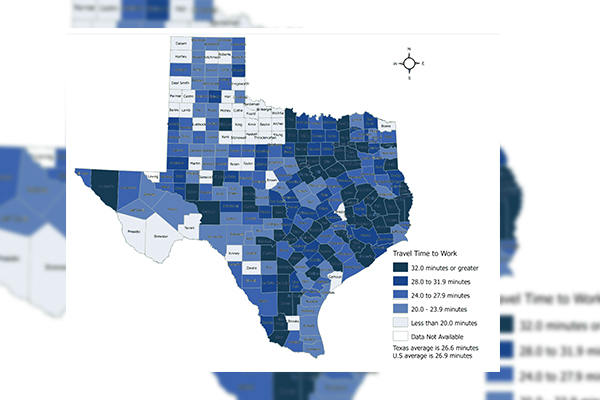
The Texas Demographic Center collects data on how commuting characteristics and time has changed in Texas between 2015 and 2020.
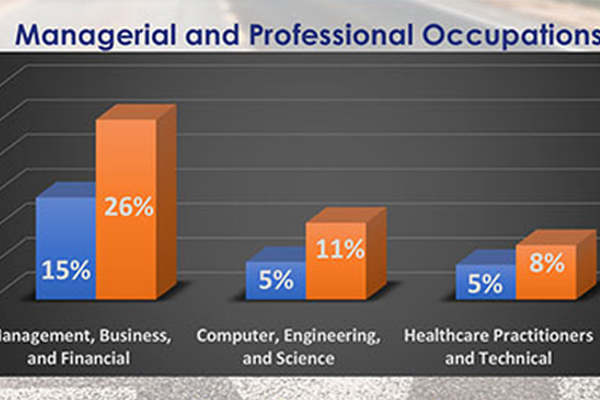
Many people from other states in the U.S. are deciding to make Texas their home. These new Texans, or net domestic migrants, are more likely to be between the ages of 25-44, more ethnically diverse, rent their homes, have children, and more likely to have been born in another country than current Texas residents. They are also more likely to have a Bachelor’s degree or higher, earn more than the median income of current Texans, and have occupations in business, computer, engineering, and health care.
Texas continued its strong population growth in the year following the outbreak of the COVID-19 pandemic, according to the newly released Vintage 2021 Population Estimates by the U.S. Census Bureau. Since April 1, 2020 (Census Day), Texas has added 382,436 people to its population, growing by 1.3%, compared to only 0.13% of the nation. Although the growth from international migration and natural increase has slowed down, net domestic migration has increased and accounted for more than 55% of the growth since 2020, up from 31% when compared to the last decade between 2010-2020.
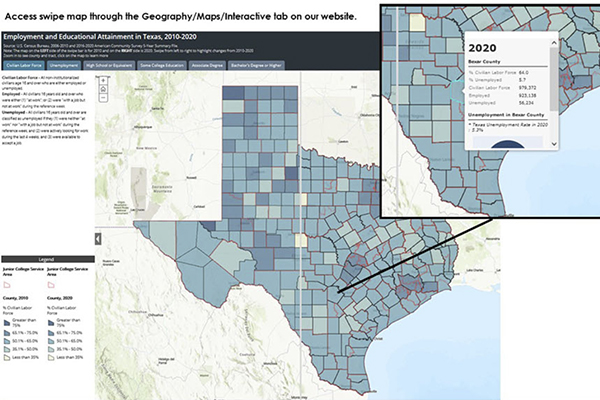
The Texas Demographic Center has created an interactive swipe map to highlight changes in education and employment indicators between 2010 and 2020 in Texas. We feature some highlights on how Texas ranked among other states on certain indicators as well as how counties faired over the decade.

The Texas Demographic Center recognizes the contributions of women in Texas during Women's History Month. Explore our infographic highlighting the progress women have made in education and the workforce.

This infographic created by the Texas Demographic Center, shows data reflecting how the African American community has changed through the years in Texas.